252
Date
Purchases
Sales
Balance
Quantity Unit Cost Value Quantity Unit Cost Value Quantity Unit Cost Value
March 1
10
$100
March 5
50
$12 $600
60
$700
March 15
40
$14 $560
100
$1,260
March 19
20
$16 $320
120
$1,580
Average Inventory for the Month
120
$13.17 $1,580
Sales for the Month
65
$13.17 $856
55
$13.17
$724
Ending Inventory
$724
________________
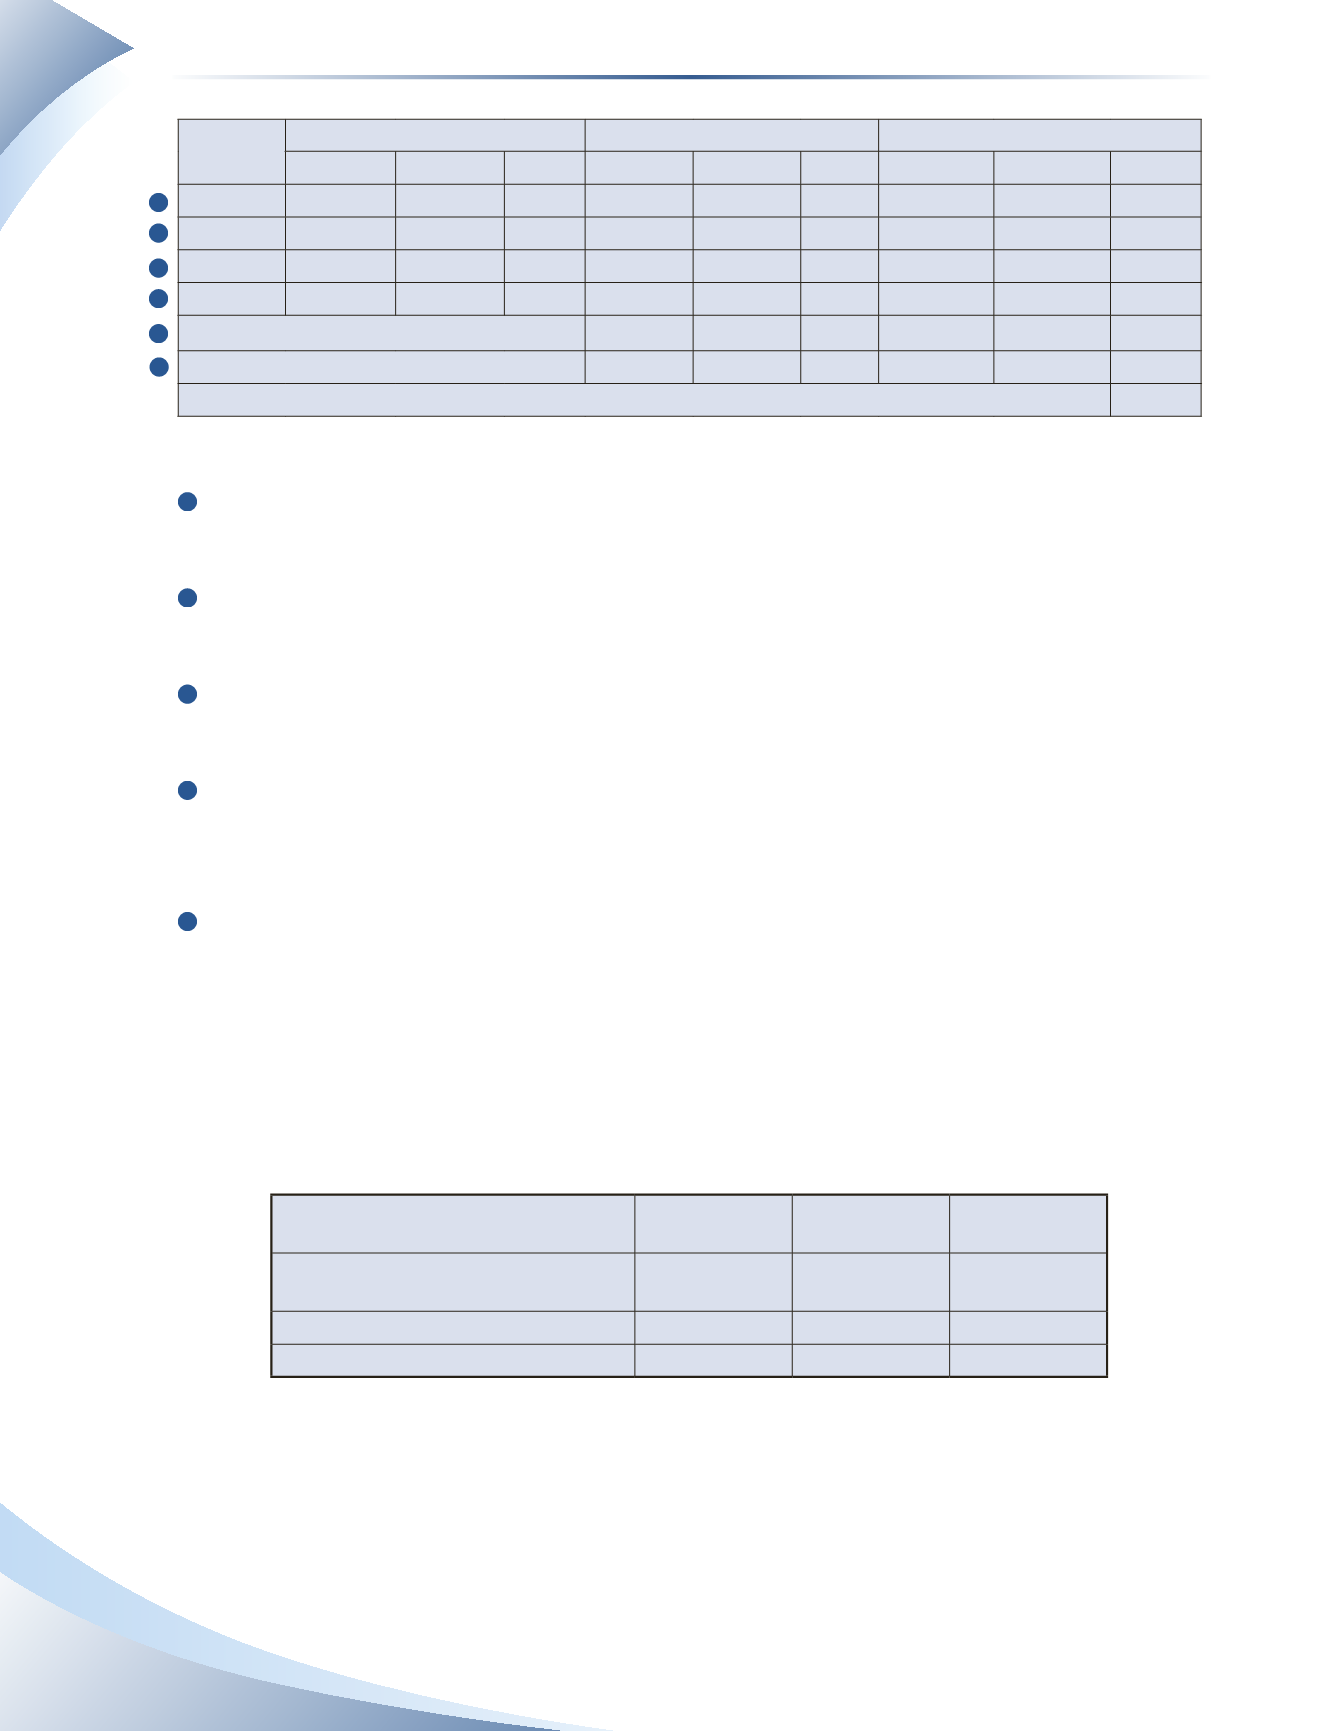
FIGURE 8A.4
1
The purchase of 50 pens on March 5 is added to the quantity on hand.The value of the 50 pens
is added to the value of the opening inventory.
2
The purchase of 40 pens on March 15 is added to the quantity on hand. The value of the 40
pens is added to current value of inventory.
3
The purchase of 20 pens on March 19 is added to the quantity on hand. The value of the 20
pens is added to current value of inventory.
4
At the end of the month, there are 120 pens available for sale with a total cost of $1,580. The
average cost per pen is approximately $13.17 ($1,580 ÷ 120 units).This average cost is applied
to the total sales of 65 pens for the month.Total cost of goods sold is $856 (65 units × $13.17).
5
The value of ending inventory is 55 pens at the average unit cost of approximately $13.17. Total
value of inventory is $724.
The Effect of Different Valuation Methods: Periodic
As the previous example with Cool Ink Company demonstrates, different ending inventory figures
are produced by using different valuation methods. The chart in Figure 8A.5 summarizes these
differences for the Cool Ink example.
Periodic Inventory System Specific
Identification
FIFO
Weighted-
Average Cost
Inventory Available for Sale
(beginning inventory + purchases)
$1,580
$1,580
$1,580
Ending Inventory
790
810
724
Value of COGS
790
770
856
________________
FIGURE 8A.5
Note that the FIFO method resulted in the highest value of ending inventory and the lowest value
of COGS during a period in which prices were rising. This is the same result as the perpetual
inventory system.
1
2
3
4
5
6
Chapter 8 Appendix
Inventory Valuation


