Chapter 8
Inventory Valuation
240
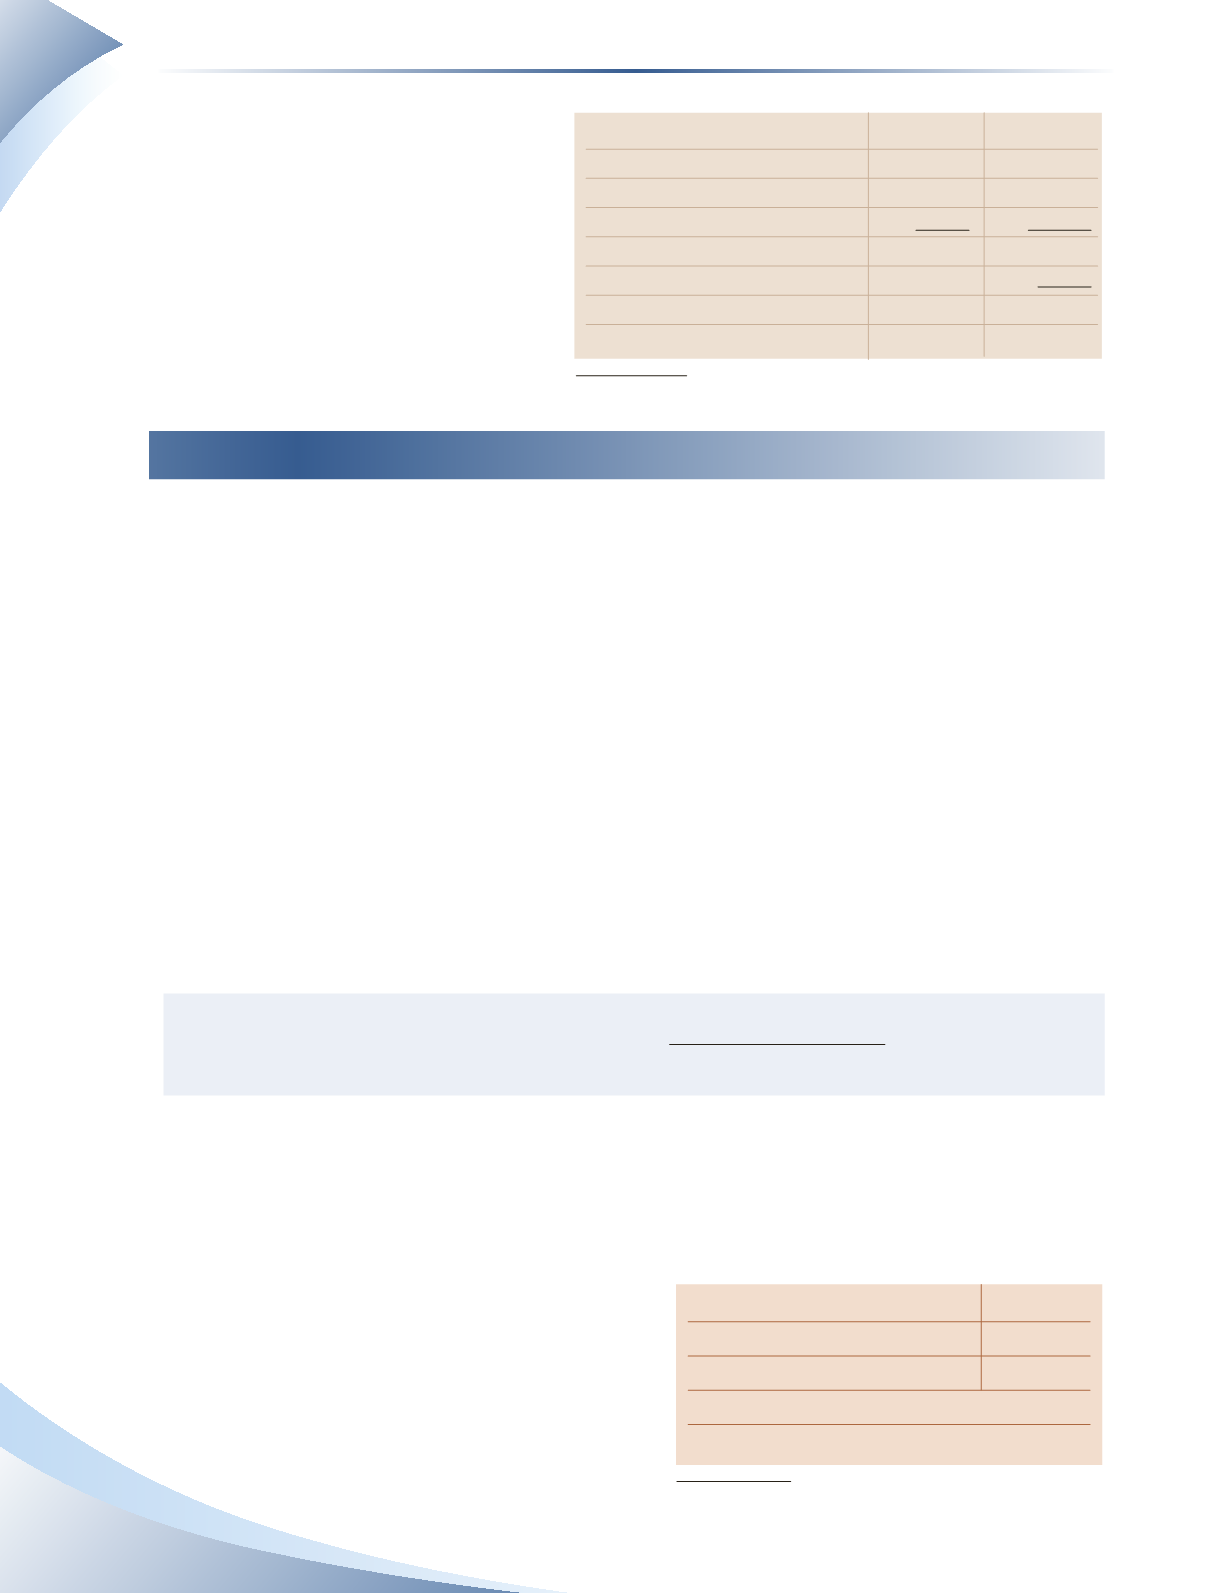
Figure 8.18 shows the closing inventory
at cost, using the retail method of
inventory estimation, which is added
to the bottom of the Leung Retail
Company chart.
Measuring Inventory Using Financial Ratios
Generally speaking, a business wants to be as precise as possible in buying inventory for resale.
Ideally, inventory should be sold as soon as it is bought. In other words, the less time that an item
spends in inventory, while still meeting customer demand, the better.
A company can measure the extent to which it is moving inventory through the use of two ratios:
inventory turnover and days inventory on hand.
Inventory Turnover Ratio
The extent to which an organization can quickly sell inventory on hand is known as inventory
turnover. Specifically, the
inventory turnover ratio
estimates how many times a year a company is
buying inventory.The more often a company buys inventory, the less likely it is that the inventory
sits for extended periods of time, and the more likely it is that the turnover is high.
The inventory turnover ratio is calculated by taking the cost of goods sold for a year and dividing
it by average inventory.
Inventory Turnover Ratio = Cost of Goods Sold
Average Inventory
Average inventory is calculated by adding the opening and closing inventory numbers and dividing
the total by 2.
New Tech Mobile makes mobile devices. Its inventory and cost of goods sold are shown in Figure
8.19. For 2016, it had an inventory turnover of 6.2. This means the company bought and sold its
entire inventory just over six times during the year.
Inventory turnover is useful when it is compared
to another company within the same industry.
Suppose a competitor has an inventory turnover
of 9.0. This is higher than that of New Tech
Mobile and is more desirable.The higher turnover
$501.3
$428.1
Cost of Goods Sold
$2,882.8
Average Inventory (501.3 + 428.1) ÷ 2 = 464.7
Turnover
2,882.8 ÷ 464. 7 = 6.2
Inventory—December 31, 2015
Inventory—December 31, 2016
FIGURE 8.19
At Cost
At Retail
Cost of Goods Sold
Opening Inventory
3,000
Purchase
Cost of Goods Available for Sale
Less Sales at Retail
Closing Inventory at Retail
Closing Inventory at Cost
FIGURE 8.18
70,000
73,000
$36,500
6,000
134,000
140,000
70,000
70,000


