Chapter 8
Inventory Valuation
233
The Impact of Cost of Goods Sold on Gross Profit
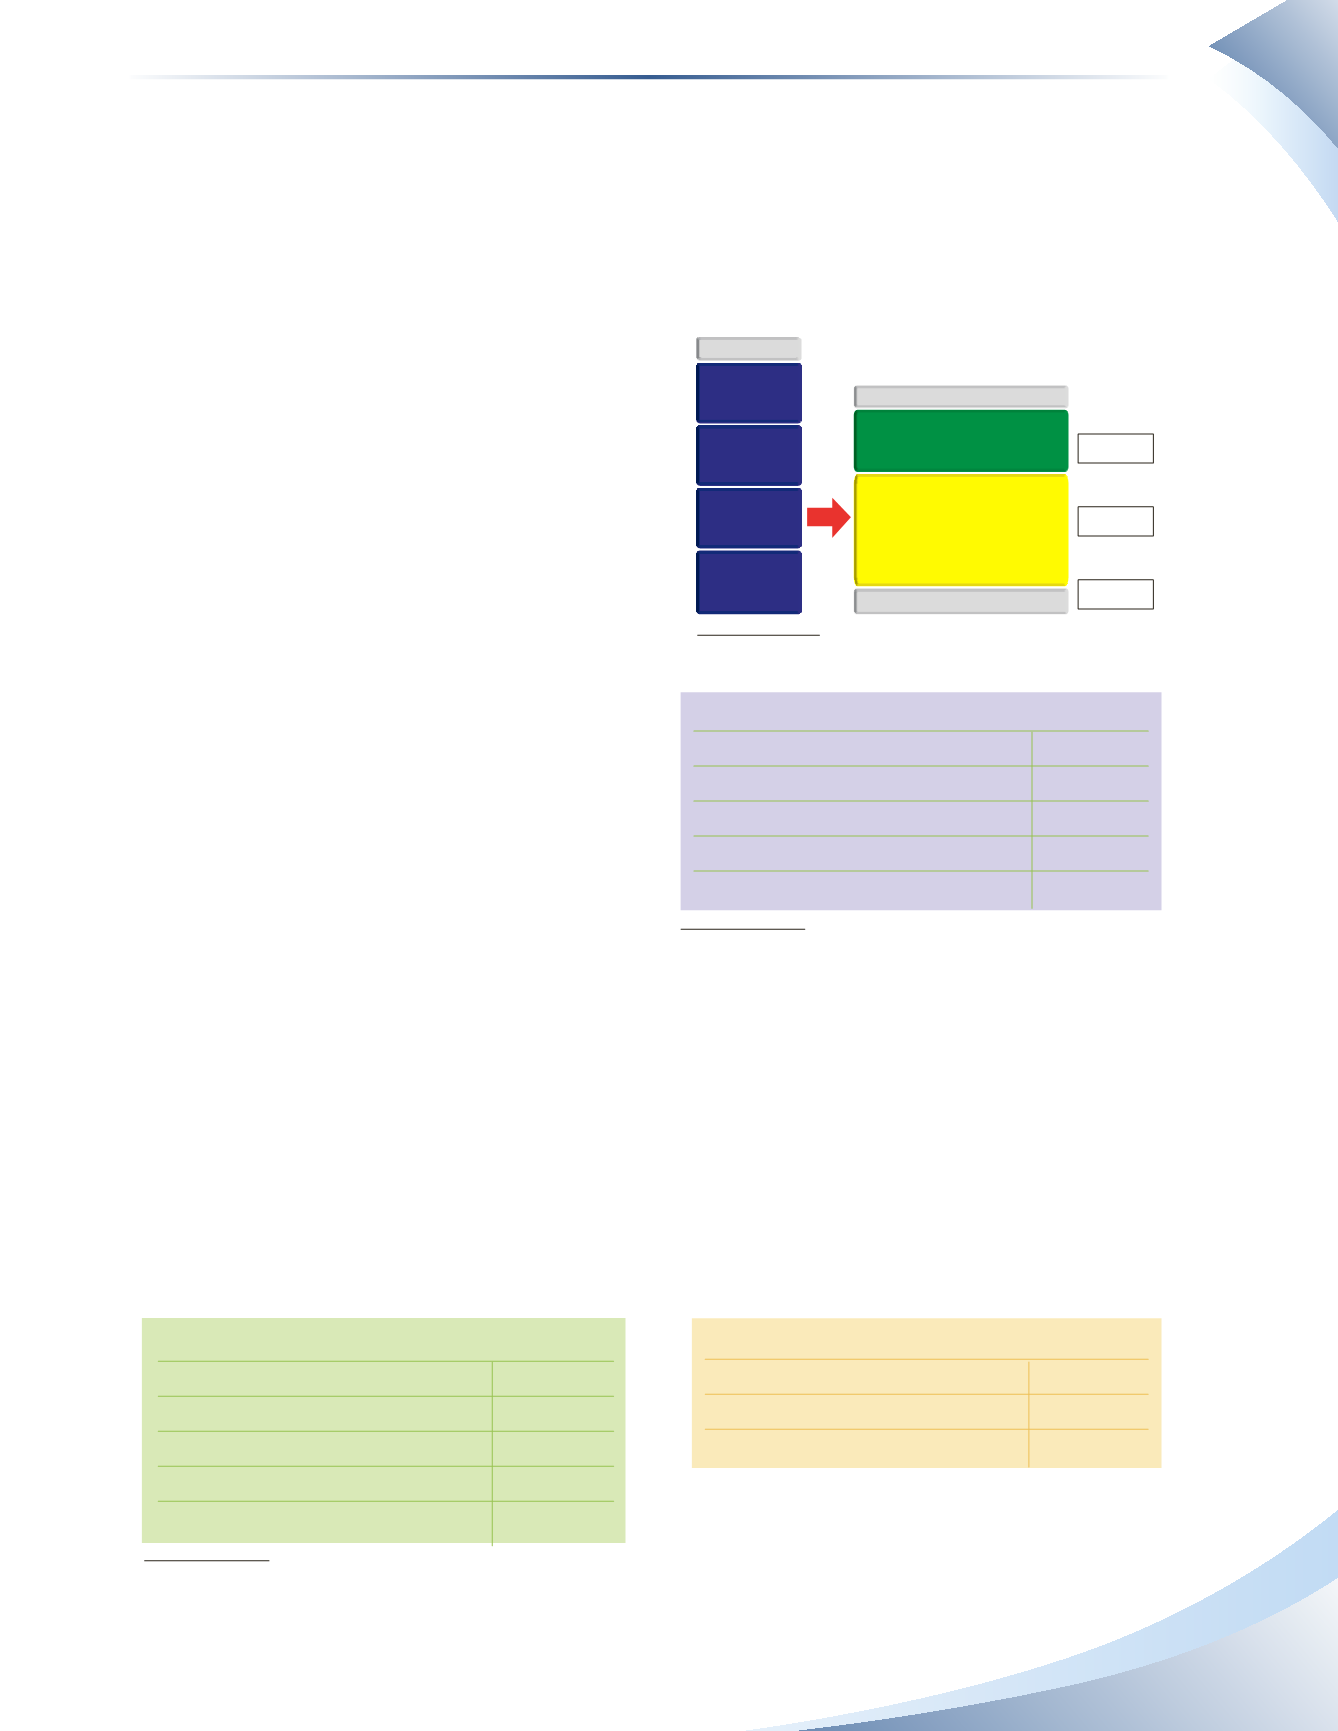
Although inventory is a balance sheet account, it can have an immediate impact on the income
statement because the cost of goods sold is used to calculate gross profit. Gross profit in turn is used
to calculate the gross margin percentage.The gross margin percentage represents the percentage of
sales left to pay the remaining operating expenses of the company.
This relationship between inventory and gross
profit is demonstrated in Figure 8.6.
It should become clear that the cost of goods sold
is a focal point when dealing with inventory on a
company’s financial statements.
In a periodic inventory system,COGS is calculated
by adding total inventory purchases to the value of
inventory on hand at the beginning of the period,
then deducting the closing value of inventory at
the end of the period. The closing value of
inventory is determined by a physical count. An
example of the calculation is shown in Figure
8.7.
In other words, a company’s COGS represents
the amount of inventory that is used/sold in a
period.
Errors in valuing closing inventory can affect COGS and, as a result, gross profit. Beyond affecting
COGS and gross profit, an incorrect inventory value affects opening inventory for the next period.
We will examine the impact on gross profit while ignoring the effects on net income for the year.
The Effect of Overstating Inventory
We will use two examples. One set of charts will include the correct amount for closing inventory;
the other set of charts will include an incorrect amount for closing inventory.
We will then look at how this error affects the other important figures on the company’s financial
statements. Figure 8.8 shows the correct numbers.
Inventory Calculation
Opening Inventory
5,000
Plus: Purchases
75,000
Cost of Goods Available for Sale
80,000
Less: Closing Inventory
9,000
Cost of Goods Sold
71,000
Income Statement Year 1
Sales
$100,000
Less: Cost of Goods Sold
71,000
Gross Profit
$29,000
FIGURE 8.8
CURRENT ASSETS
CASH
OTHER CURRENT
ASSETS
ACCOUNTS
RECEIVABLE
INVENTORY
INCOME STATEMENT
GROSS PROFIT
REVENUE
COST OF GOODS SOLD
$10,000
$6,000
$4,000
minus
equals
= 40%
Gross Margin
FIGURE 8.6
Inventory Calculation
Opening Inventory
10,000
Plus: Purchases
60,000
Cost of Goods Available for Sale
70,000
Less: Closing Inventory
20,000
Cost of Goods Sold
50,000
FIGURE 8.7


