Chapter 8
Inventory Valuation
239
Cost of Goods Available for Sale
−
Cost of Goods Sold = Closing Inventory
$73,000
−
$50,000 = $23,000
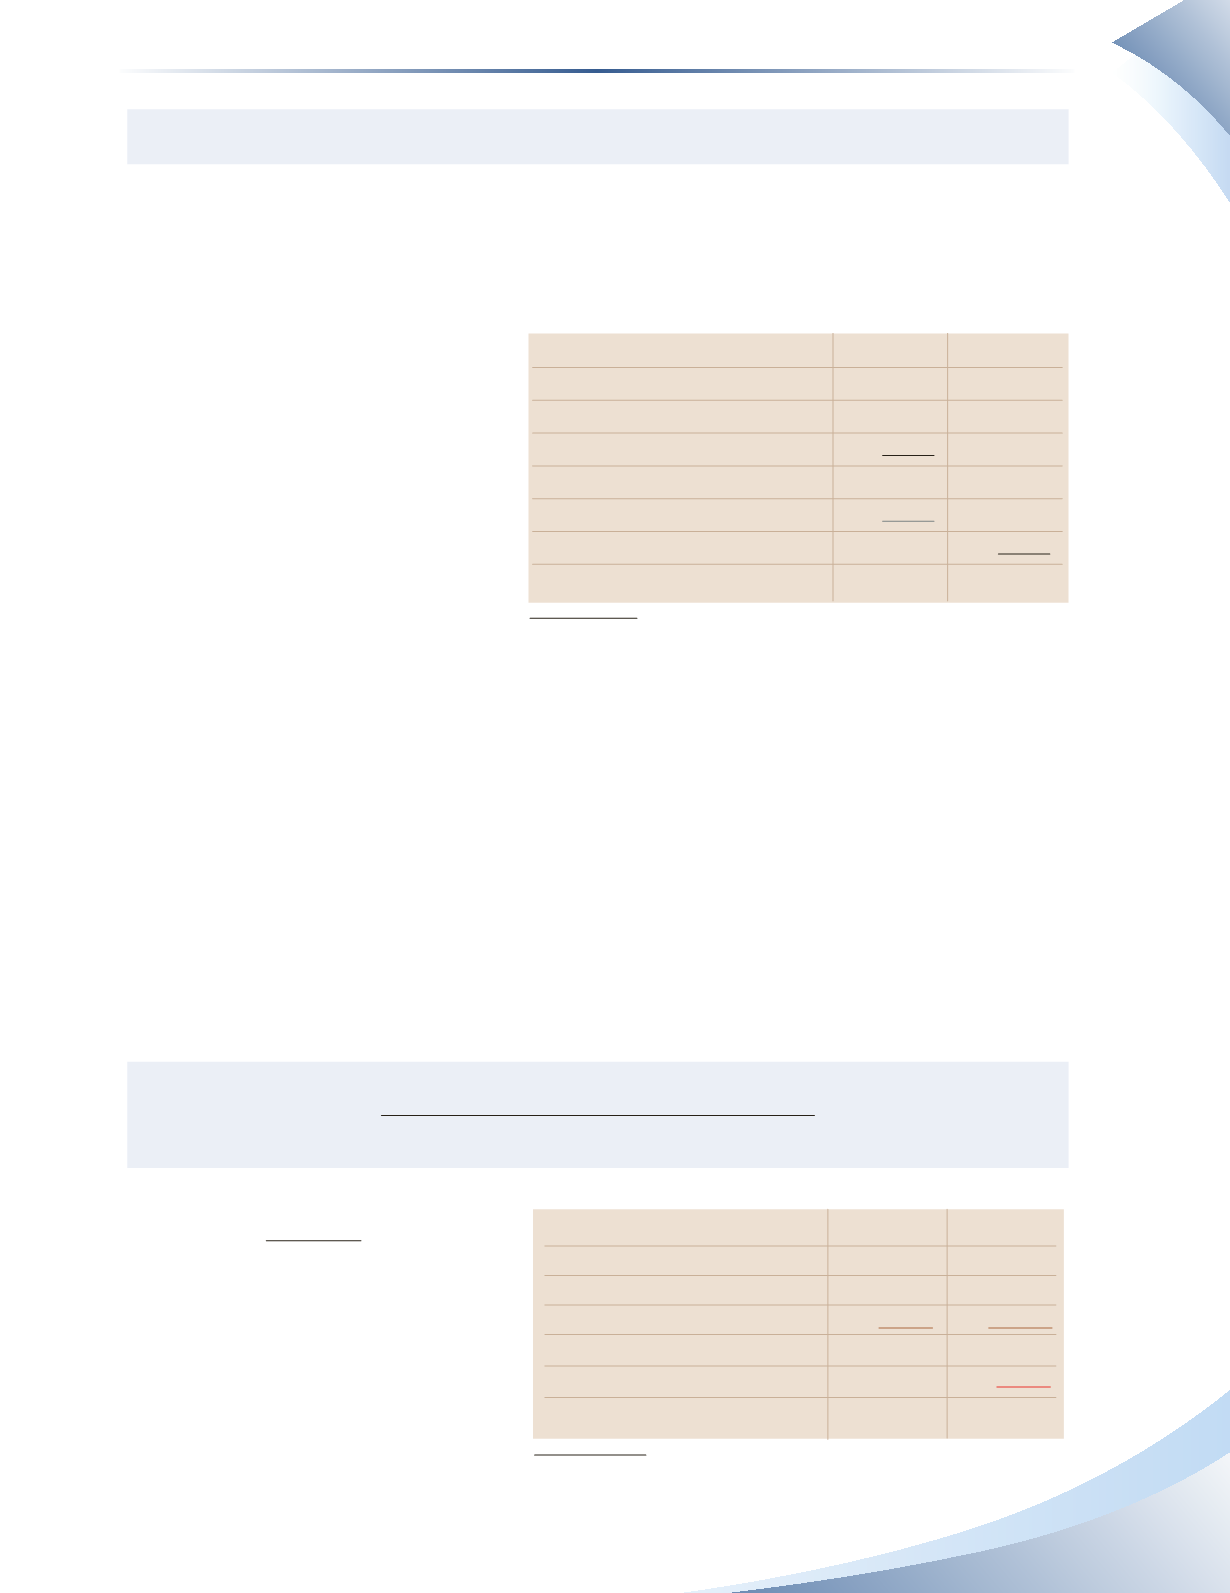
Therefore, the gross profit method yields a closing inventory estimate of $23,000, which is marked in
grey in Figure 8.16.This figure will be used on the quarterly balance sheet for Van Der Linden.
To summarize: The gross profit
method starts with historical analysis
that yields a gross profit margin.This is
applied to sales revenue, which yields
a gross profit figure. Each subsequent
step calculates an additional piece of
information until a figure for closing
inventory is obtained. This is the
estimation that is used for the quarterly
financial statements.
The Retail Method
The
retail method
of estimating inventory requires less information and fewer steps than the gross
profit method. Specifically, it requires two things: 1) the value of sales at retail prices (which is
why it is called the retail method); and 2) the company’s cost of goods sold section on the income
statement.
For example, refer to Leung Retail Company's information in Figure 8.17.The cost of goods sold
section is shown in brown, and the sales figure at retail is shown in red.The section shown in green,
which is the cost of goods available for sale, is calculated by adding opening inventory and purchases
together.This section is important because the cost and retail figures for cost of goods available for
sale will be used in ratio format as shown below.
Cost of Goods Available for Sale at Cost
Cost of Goods Available for Sale at Retail
$73,000
$140,000
This ratio must be applied to the
closing inventory at retail figure, which
is marked in blue.
$70,000 x 52.1% = $36,500
Sales Revenue
100,000
Cost of Goods Sold
Opening Inventory
3,000
Purchases
Cost of Goods Available for Sale
73,000
Closing Inventory
Cost of Goods Sold
50,000
Gross Pro t (Gross Margin = 50%)
50,000
FIGURE 8.16
70,000
23,000
At Cost
At Retail
Cost of Goods Sold
Opening Inventory
3,000
6,000
Purchases
70,000
Cost of Goods Available for Sale
73,000
140,000
Less: Sales at Retail
Closing Inventory at Retail
70,000
FIGURE 8.17
134,000
70,000
= 52.1%


