Chapter 12
Using Accounting Information
356
clearer idea of how the company’s financial situation would be affected if the assets were sold at
the end of the accounting period. While such gains and losses are not part of the daily operating
activities, they still affect the company’s comprehensive income. This means they must be presented
on the statement of comprehensive income.
We have reviewed the balance sheet and income statement from the perspectives of both a sole
proprietorship and a corporation. Now, the financial statements can be analyzed and we can learn
more about how accounting information can be used for decision making.
Horizontal and Vertical Analysis
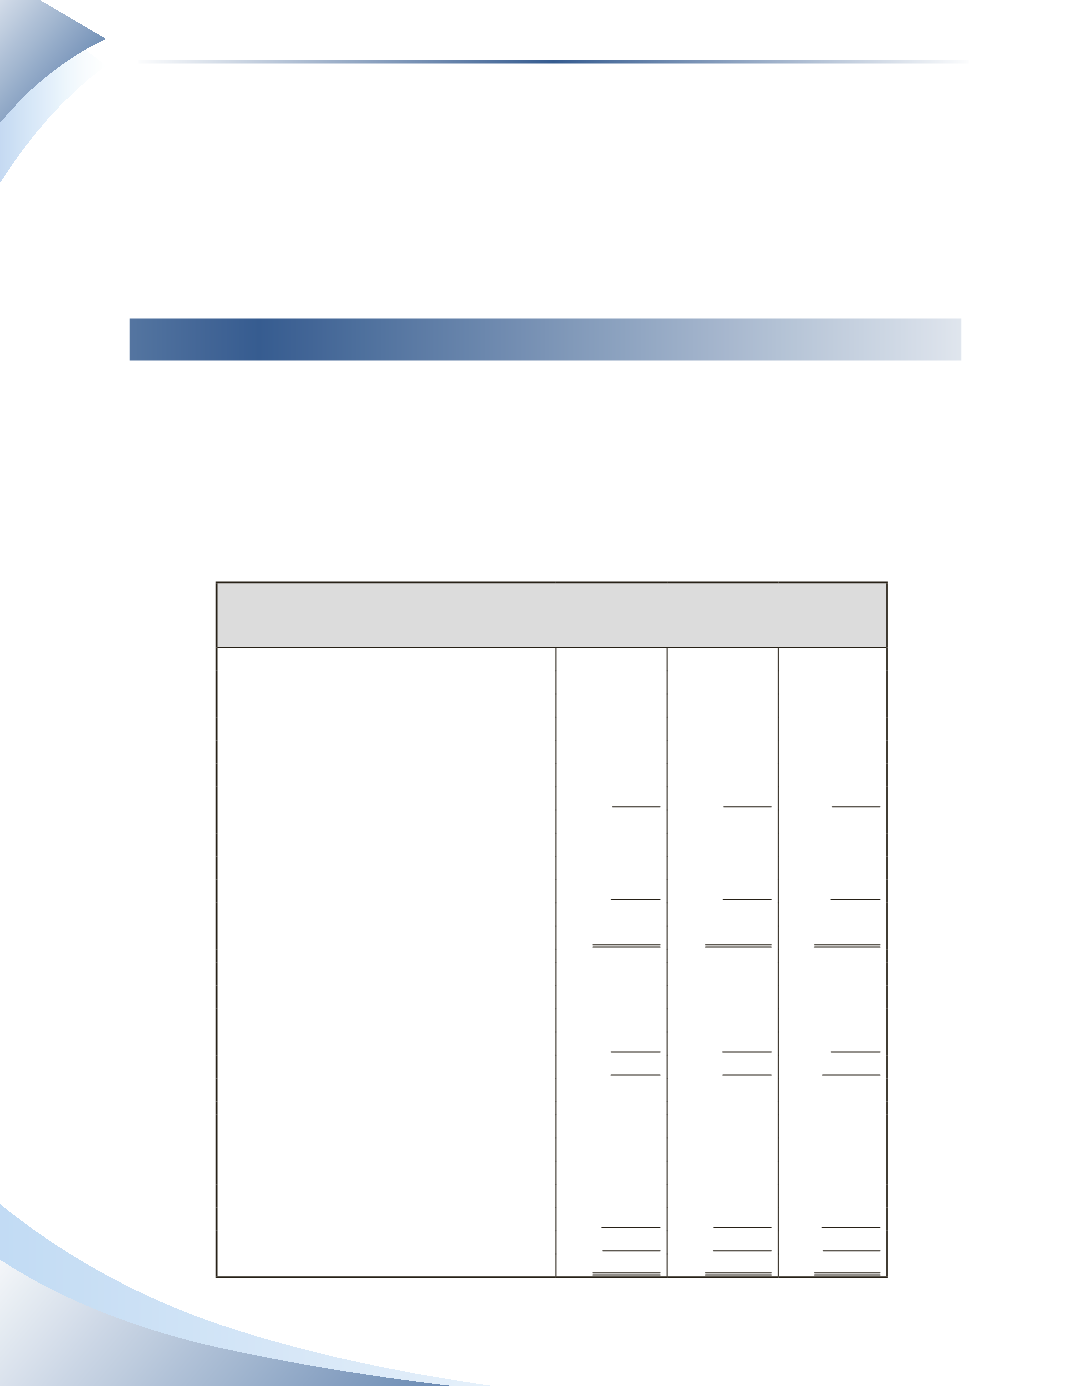
We will inspect the balance sheet of Star Hotel, a Canadian hotel corporation. Suppose this
company is planning to renovate to offer more rooms and services. It has contacted the bank to
secure a bank loan, but the bank must determine whether the company is profitable and will be able
to afford the loan and interest payments.The bank has asked for Star Hotel’s financial statements
for the last three years. Star Hotel’s comparative balance sheet is presented in Figure 12.5. A
comparative balance sheet
is simply a balance sheet that shows the balances for multiple years for
easy comparison. For readability, a single column is used for each year.
Star Hotel
Balance Sheet
As at December 31, 2014 - 2016
2016
2015
2014
Assets
Current Assets
Cash
$8,000
$20,000
$32,000
Accounts Receivable
100,000
70,000
40,000
Food Inventory
40,000
28,000
16,000
Prepaid Expenses
12,000
12,000
12,000
Total Current Assets
160,000
130,000
100,000
Property, Plant & Equipment
Building, Net
390,000
400,000
410,000
Equipment, Net
50,000
55,000
60,000
Total Property, Plant & Equipment
440,000
455,000
470,000
Total Assets
$600,000
$585,000 $570,000
Liabilities
Current Liabilities
Accounts Payable
$50,000
$60,000
$80,000
Unearned Revenue
30,000
25,000
20,000
Total Current Liabilities
80,000
85,000
100,000
Total Liabilities
80,000
85,000
100,000
Shareholders’ Equity
Share Capital
Common Shares—10,000 outstanding
100,000
100,000
100,000
Preferred Shares—5,000 outstanding
20,000
10,000
10,000
Retained Earnings
400,000
390,000
360,000
Total Shareholders’ Equity
520,000
500,000
470,000
Total Liabilities and Shareholders’ Equity
$600,000
$585,000 $570,000
_______________
Figure 12.5


